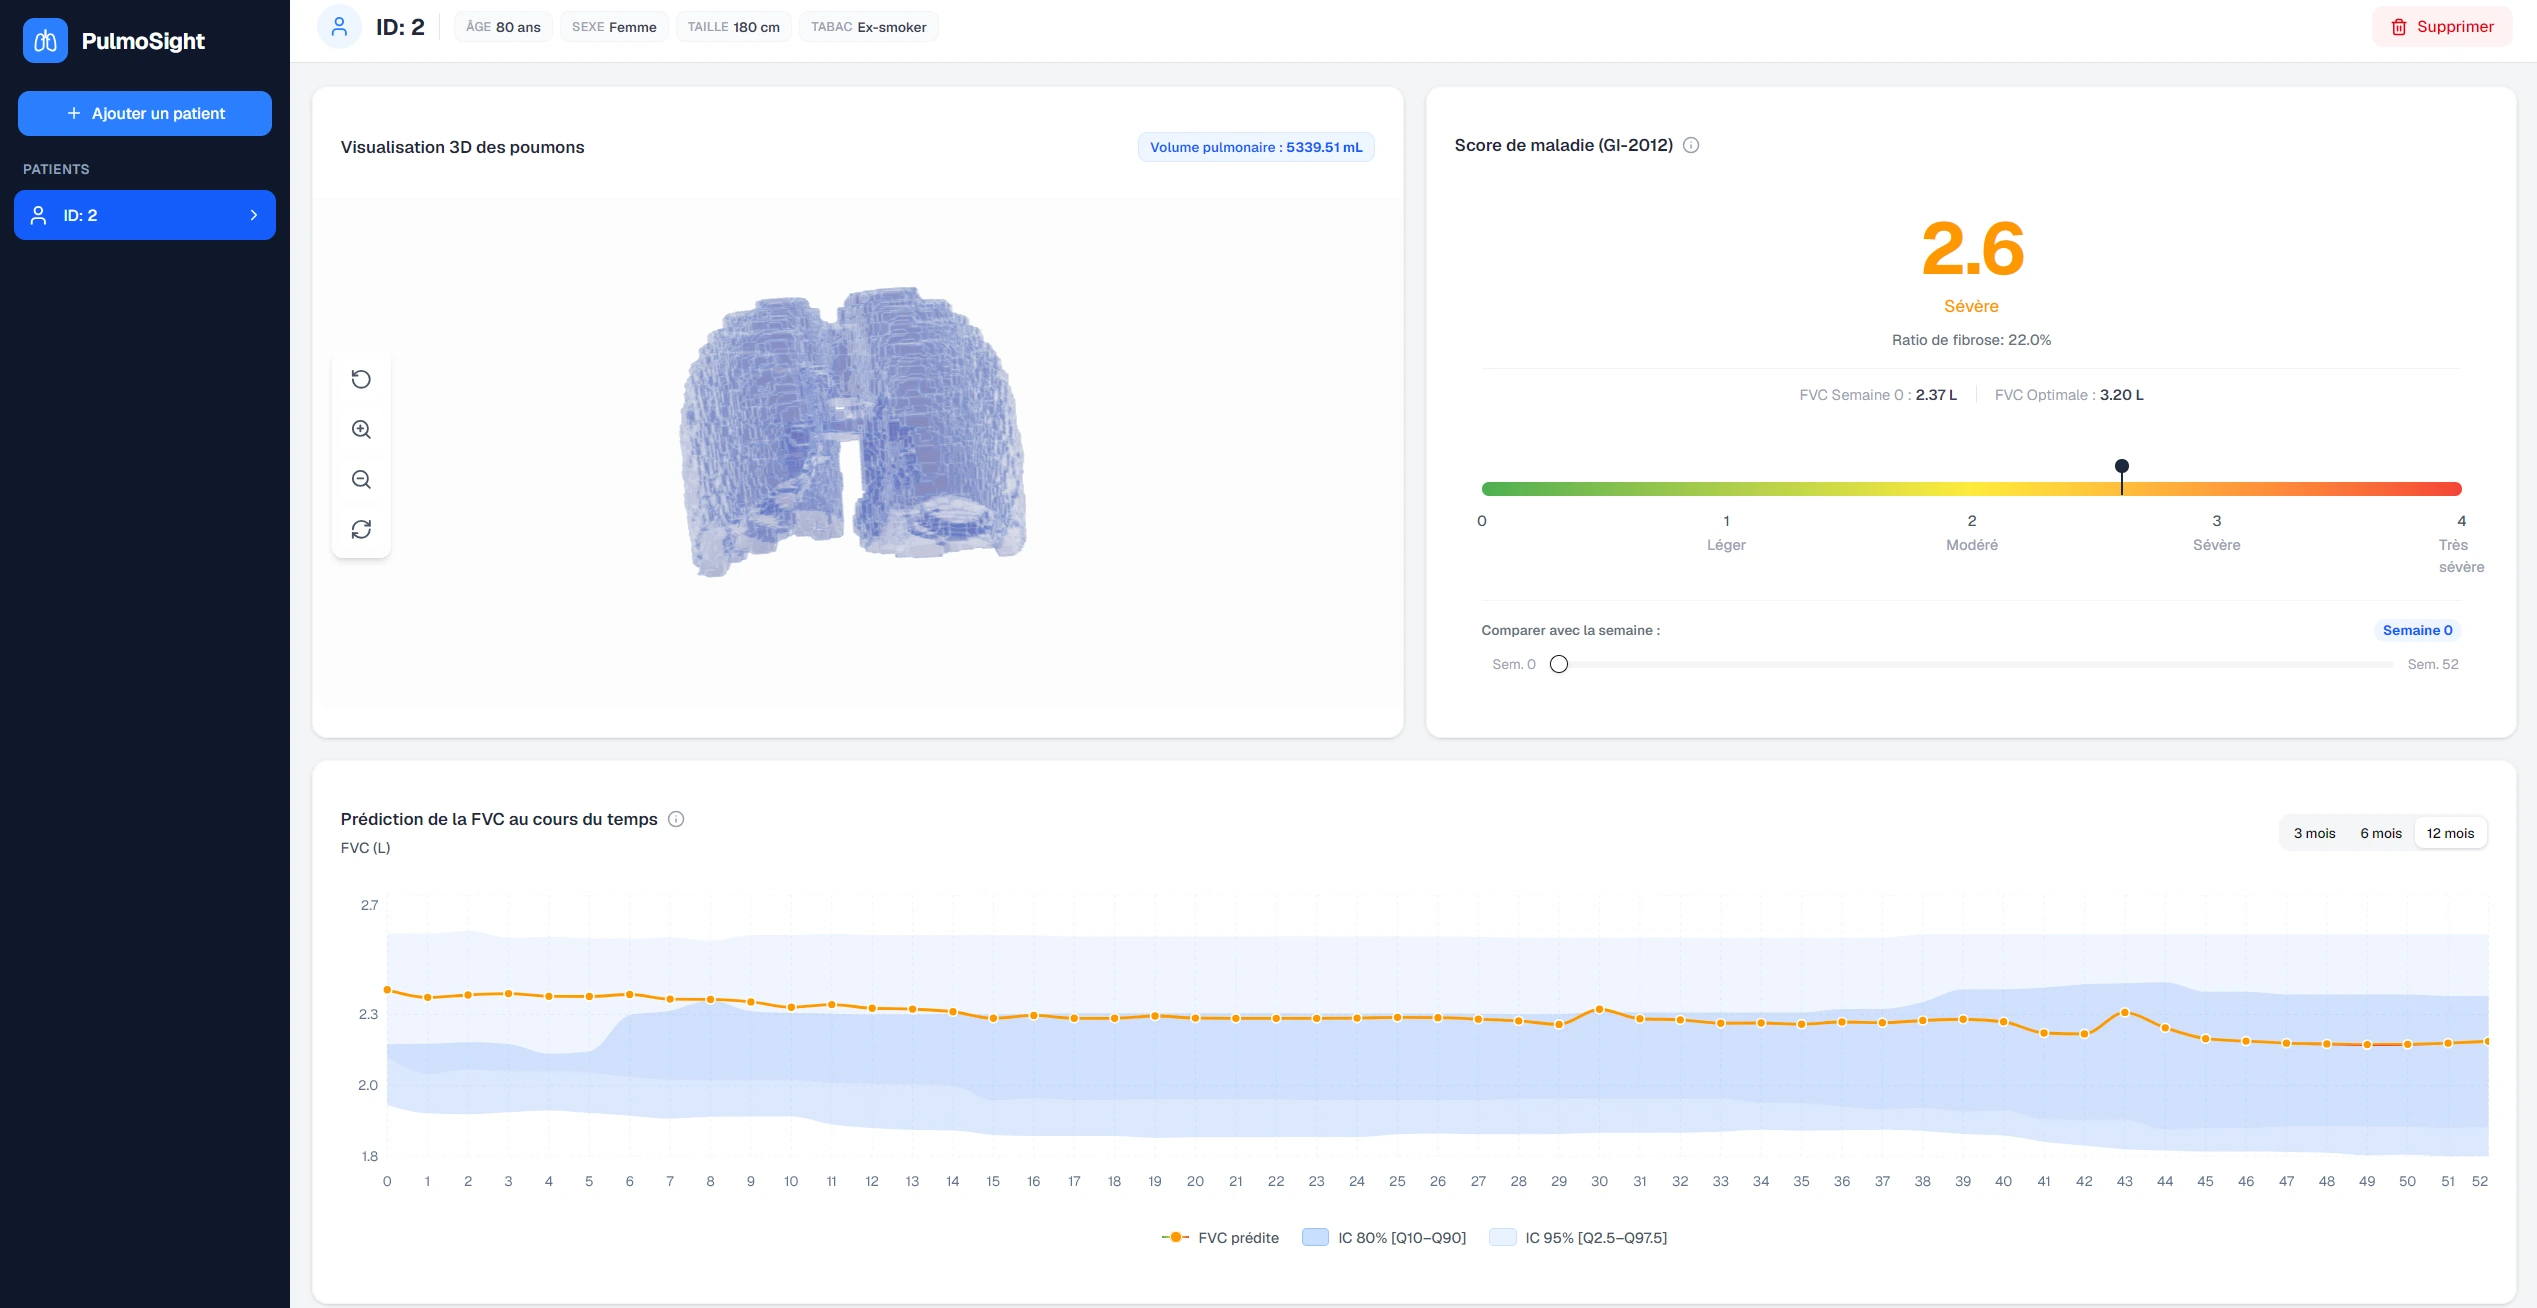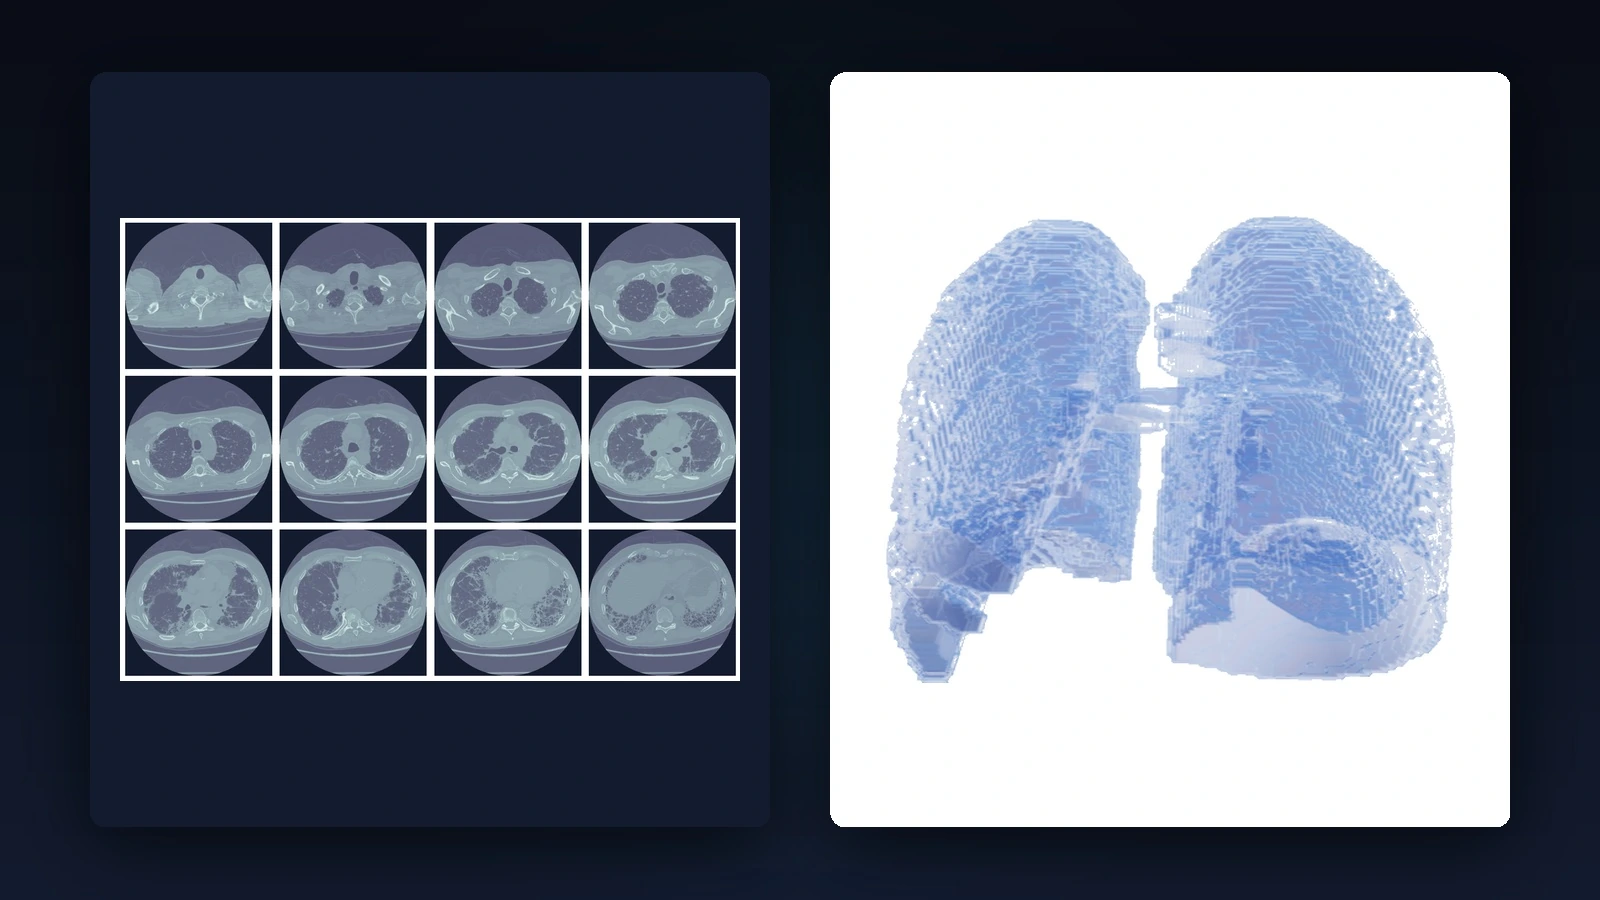
Context & Problem Statement
Idiopathic Pulmonary Fibrosis (IPF) is a chronic lung disease that causes progressive scarring of lung tissue, irreversibly compromising respiratory capacity. The primary clinical parameter for monitoring disease progression is Forced Vital Capacity (FVC), measured in mL.
The goal of MedViz was to design a full-stack medical application capable of:
- Processing 3D CT scans in DICOM format to extract quantitative radiomic biomarkers.
- Predicting FVC decline over 3, 6, or 12 months using an ML model incorporating medical uncertainty.
- Visualizing 3D lungs interactively within a real-time web interface.
The project builds upon the OSIC (Open Source Imaging Consortium) challenge, whose dataset includes volumetric DICOM series and tabular clinical metadata (age, sex, smoking status, historical FVC).
| Data Type | Format | Description |
|---|---|---|
| 3D CT Scanners | DICOM (.dcm) |
Volumetric axial slice series |
| Clinical Data | CSV (.csv) |
Patient metadata & historical FVC |
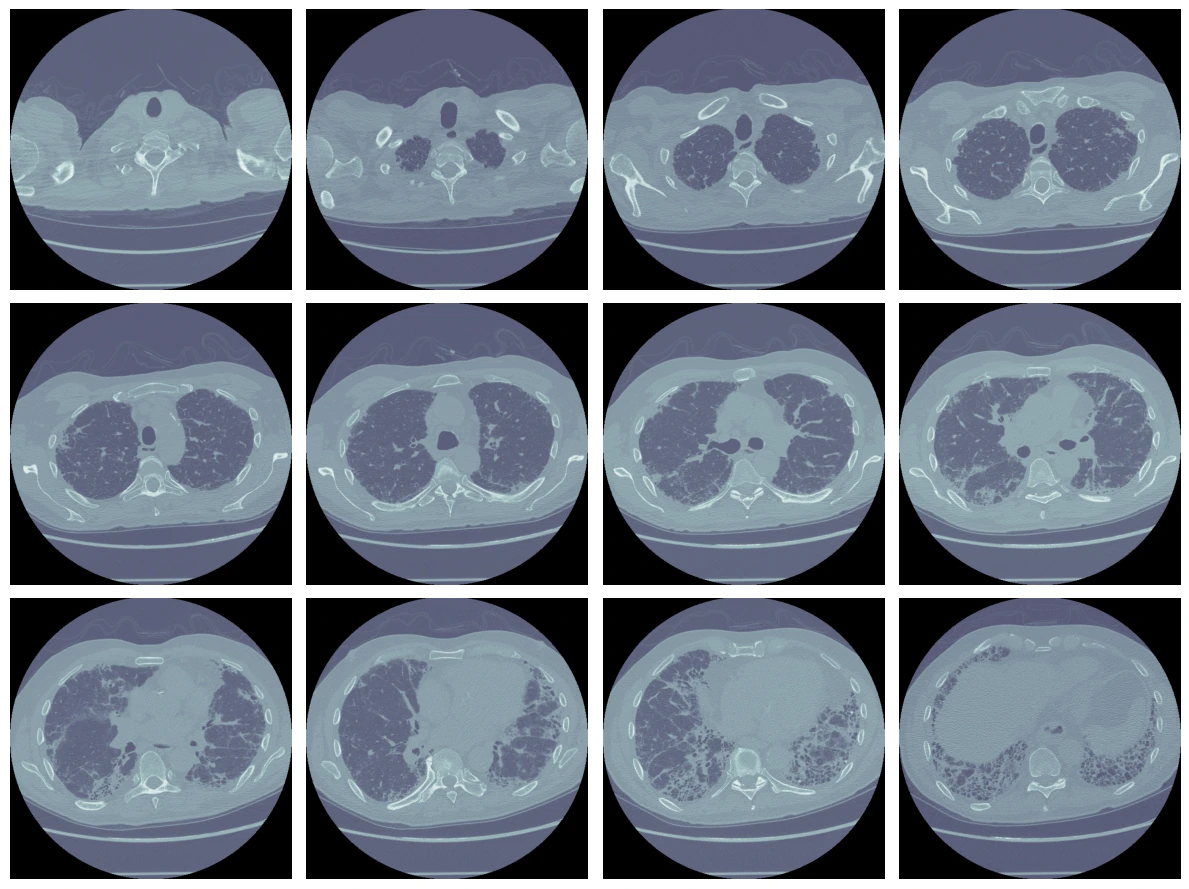
Workflow Overview
3D Medical Image Processing
1. Hounsfield Normalization (DICOM Preprocessing)
Raw grayscale values in DICOM scanners are specific to each equipment manufacturer and lack direct physical meaning. They must be converted into Hounsfield Units (HU), an absolute scale calibrated against biological tissue density:
| Tissue | HU Range |
|---|---|
| Outer Air | ≈ −1000 HU |
| Lung Parenchyma | −900 to −400 HU |
| Soft Tissue / Water | ≈ 0 HU |
| Dense Fibrotic Tissue | > −250 HU |
Once converted to HU, thresholding isolates clinically relevant regions and normalizes data across patients.
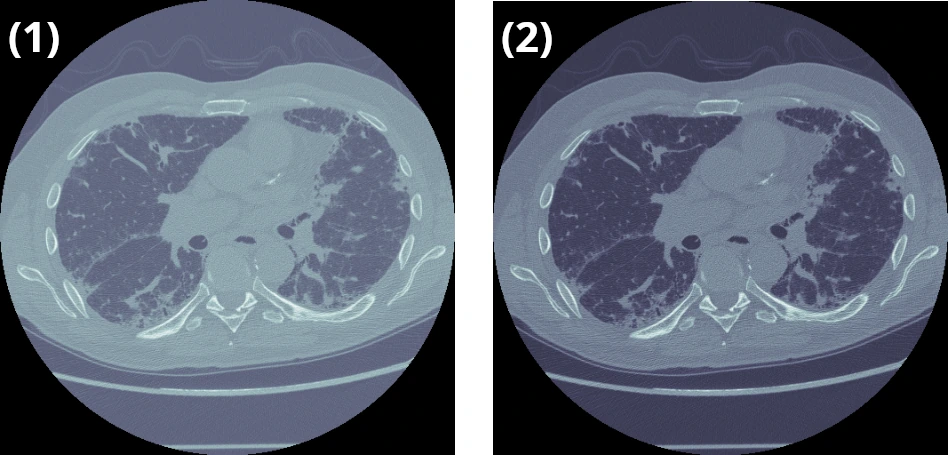
2. Isotropic 3D Resampling
CT slice thickness varies across hospital equipment. To ensure consistent geometric and volumetric measurements between patients, the 3D volume is resampled to 1 voxel = 1 mm³ (3rd-order spline interpolation via scipy.ndimage.zoom).
3. Automatic 3D Lung Segmentation
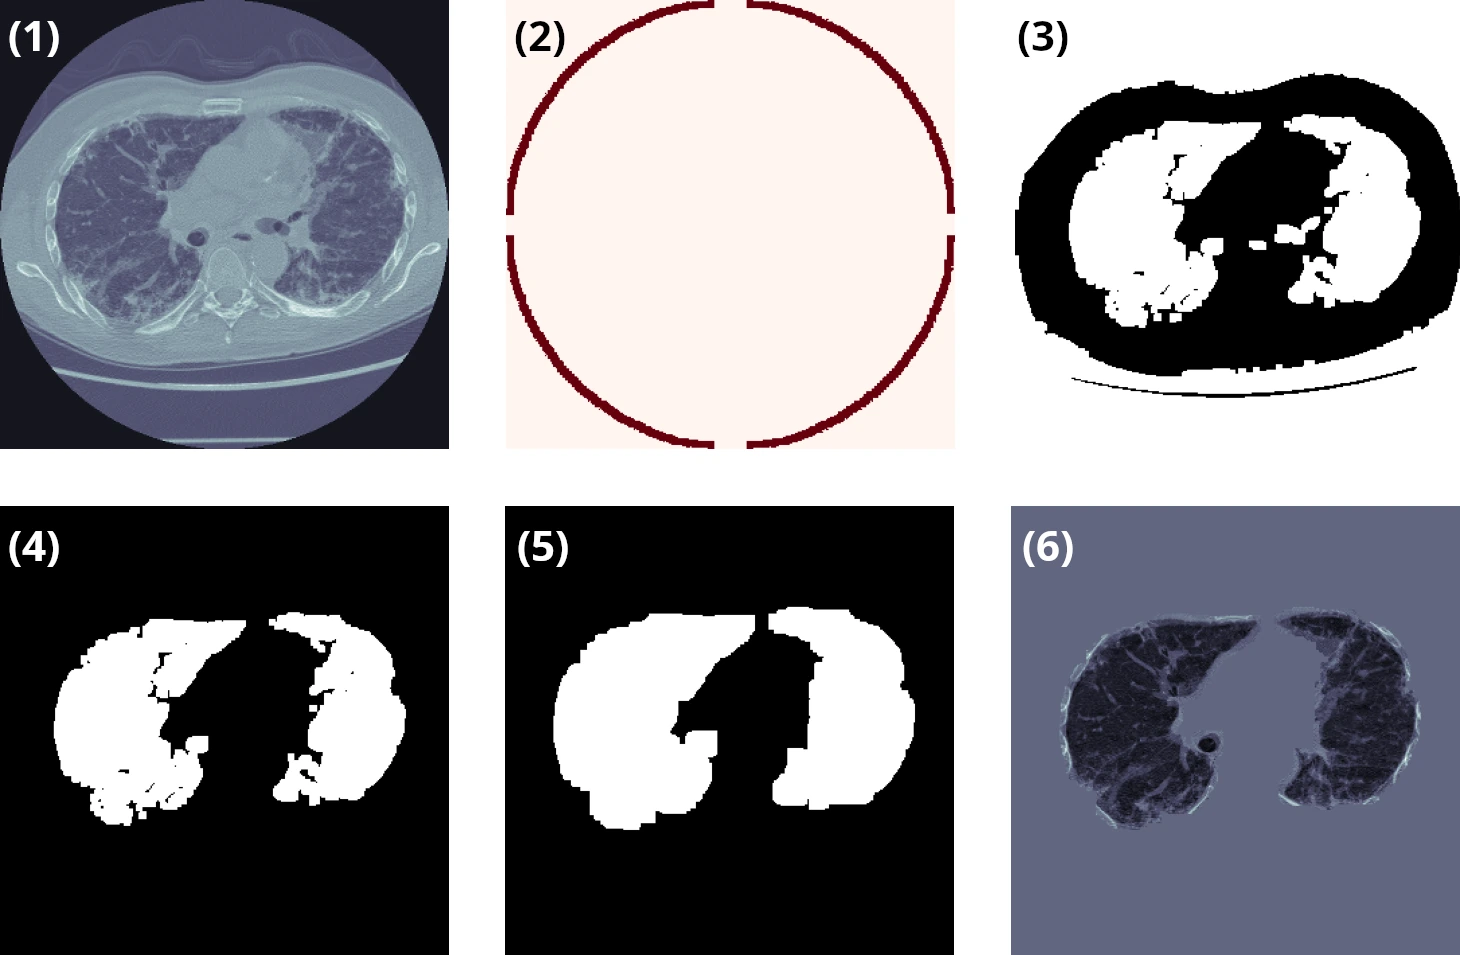
Segmentation isolates lung parenchyma from surrounding tissue (bones, muscles, outer air) via 6 numbered steps:
- Original CT Slice: Raw input axial slice.
- FOV Boundary: Masking field of view to exclude scanner borders.
- Raw Air (K-Means): Adaptive $K=2$ thresholding separating air from tissue.
- Internal Lungs: Connected Component Analysis isolating the 2 main air cavities.
- Final Mask: 3D morphological operations (closing, dilation) and noise cleanup (< 5% max volume).
- Segmented Lungs: Final result applied to the original image.
4. 3D Volumetric Reconstruction of the Lungs
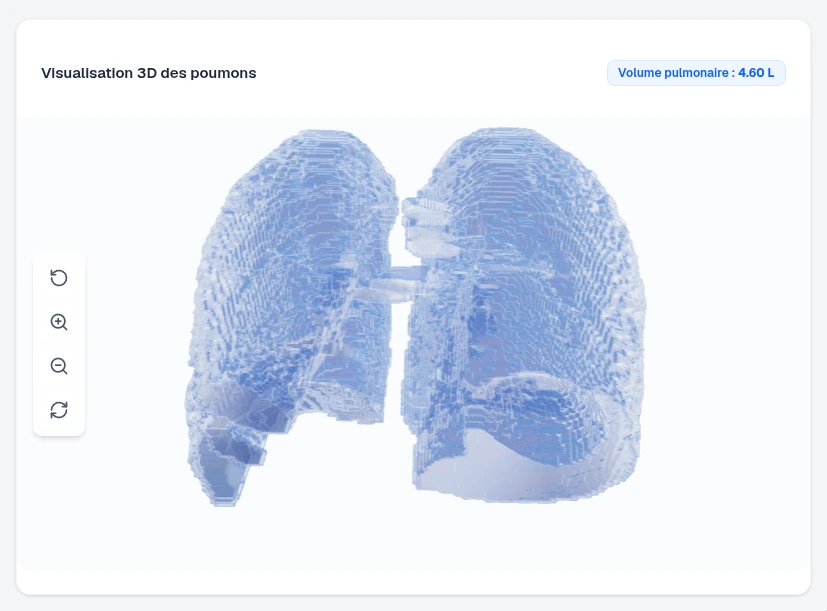
Once the stack of 2D axial slices is segmented, all masks are stacked in 3D space to reconstruct the complete respiratory system. The Marching Cubes algorithm (skimage.measure.marching_cubes) is applied to this volume to extract the isosurface of the lung parenchyma, generating a high-fidelity 3D representation of both lungs.
5. Extraction of Radiomic Biomarkers
From the reconstructed 3D volume and validated mask, three quantitative biomarkers are extracted per patient:
- Total Lung Volume: Sum of mask voxels multiplied by isotropic voxel spacing (in cm³).
- HU Density Statistics: Mean and standard deviation of Hounsfield densities within parenchyma.
- Fibrosis Ratio: Proportion of lung voxels with density > −250 HU (dense fibrotic tissue).
6. 3D Mesh Generation & WebGL Export (GLB)
The extracted 3D mesh is optimized for interactive web rendering in two steps:
- Surface Smoothing & Simplification: Normalizing vertices and computing surface normals.
- Export to GLB / glTF 2.0 Format via
trimeshfor real-time WebGL rendering directly in the browser using Three.js.
Prediction Model: Quantile XGBoost
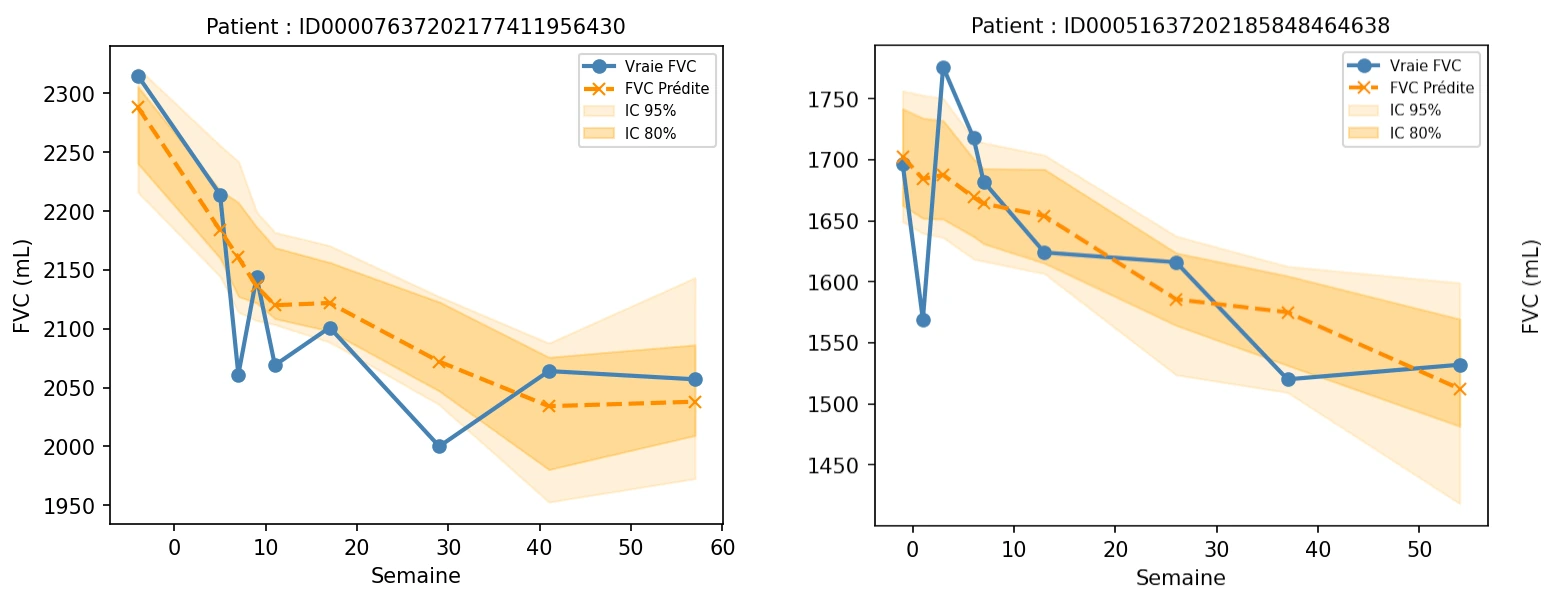
Rather than a simple point estimate, MedViz trains 5 distinct XGBoost models corresponding to quantiles of the FVC distribution:
| Quantile | Clinical Interpretation |
|---|---|
| q = 0.025 | Lower bound 95% CI (worst case) |
| q = 0.10 | Lower bound 80% CI |
| q = 0.50 | Median — central prediction |
| q = 0.90 | Upper bound 80% CI |
| q = 0.975 | Upper bound 95% CI (best case) |
Each model takes as input: target week, age, lung volume, mean HU, std HU, fibrosis ratio, sex, smoking status, baseline FVC, baseline week, and time delta.
Confidence Index and Severity Score
A continuous confidence index $C \in [0.01, 0.99]$ is derived from the width of the 95% confidence interval — the more certain the model, the higher the index.
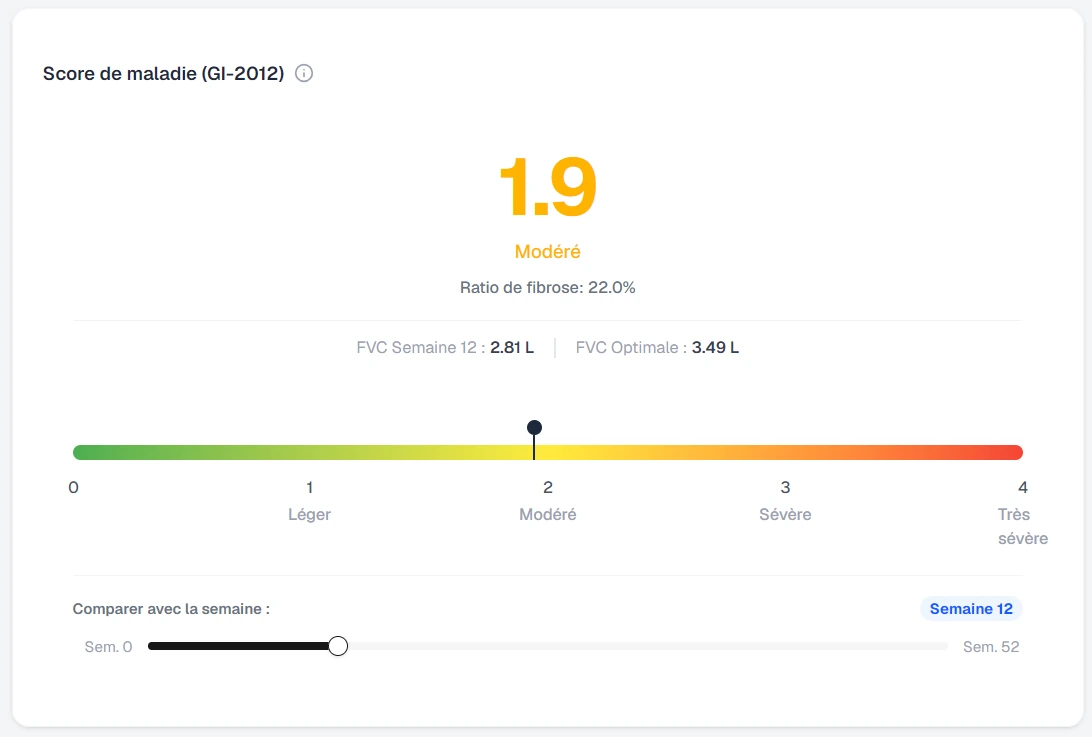
To provide a standardized medical reference, the Severity Score is calculated using GLI-2012 (Global Lung Function Initiative) equations based on patient age, height, and sex:
Results
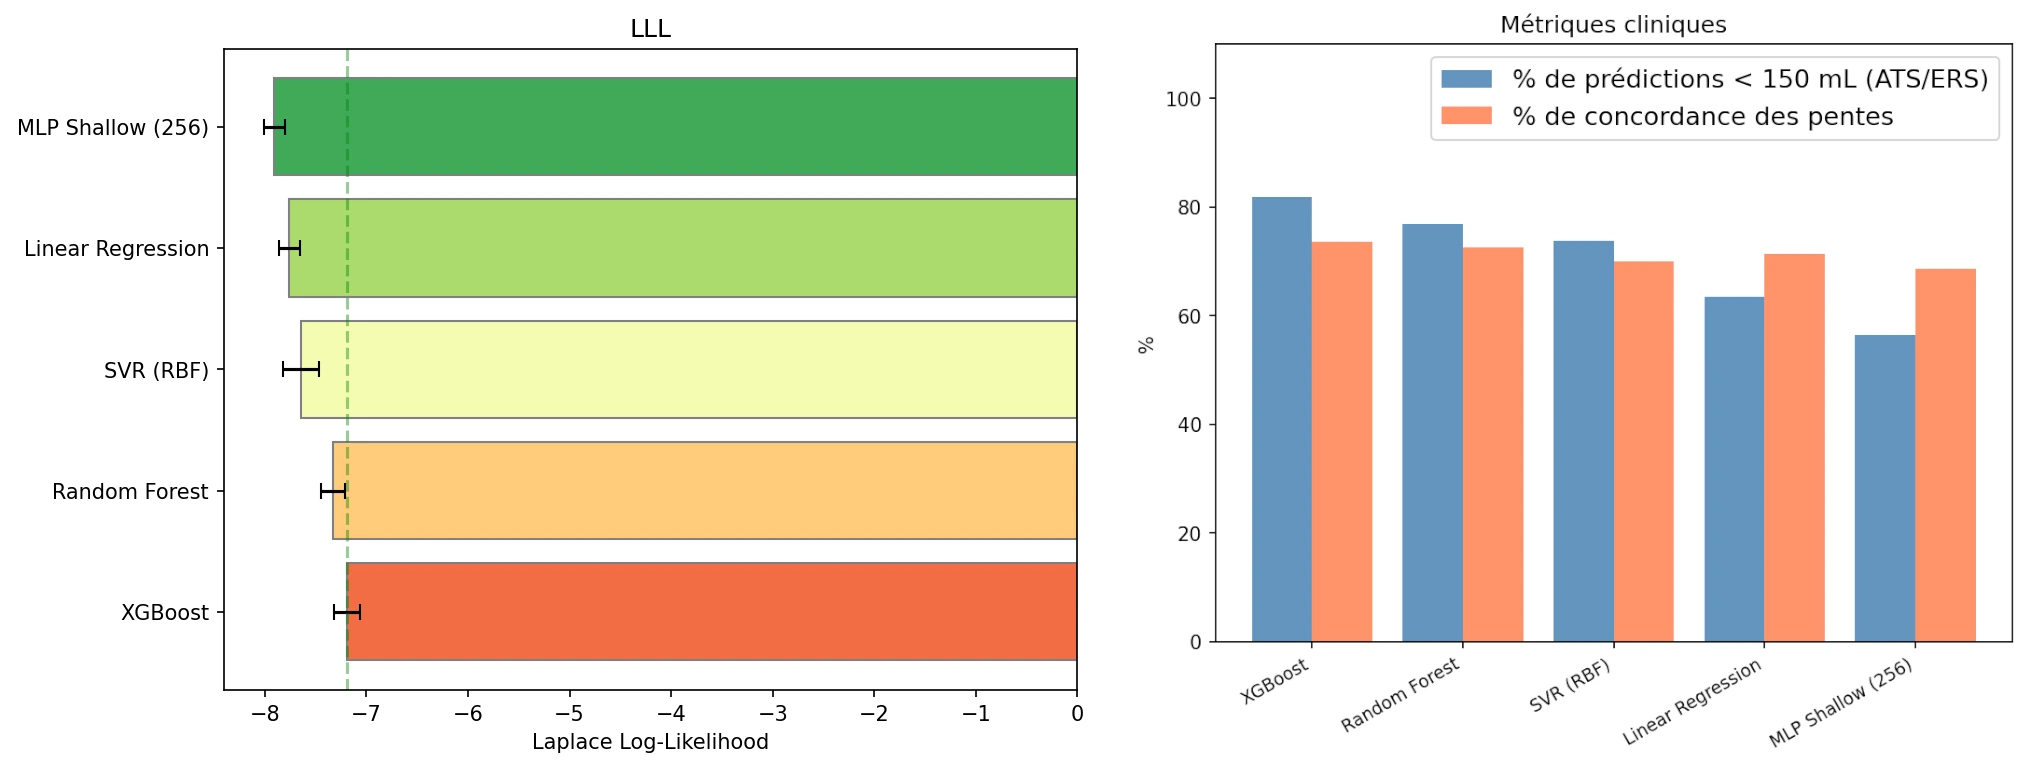
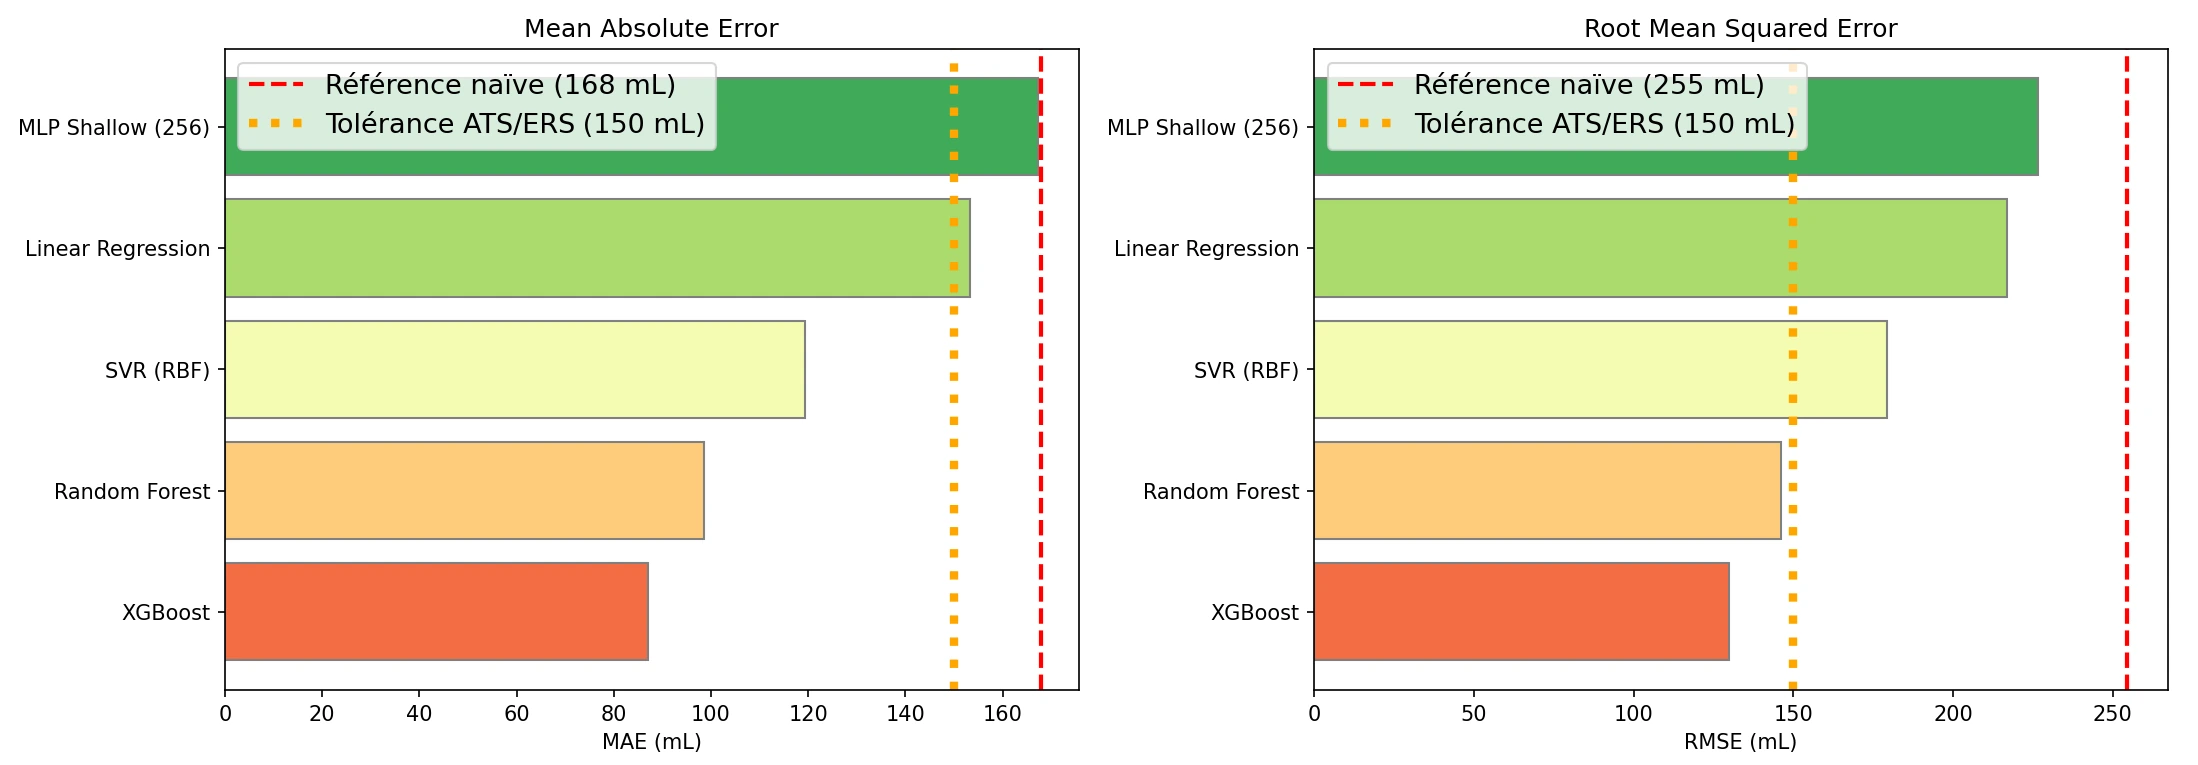
A rigorous comparative study evaluates the direct contribution of 3D radiomic biomarkers (CT Scans) compared to tabular clinical data alone:
| Model | MAE with Radiomics | MAE without Radiomics | MAE Gain | Radiomic Benefit |
|---|---|---|---|---|
| SVR (RBF) | 119.4 mL | 116.7 mL | −2.7 mL | ❌ Not useful |
| XGBoost | 87.1 mL | 94.7 mL | +7.6 mL | ✅ Useful |
| Random Forest | 98.6 mL | 109.4 mL | +10.8 mL | ✅ Useful |
XGBoost with radiomics achieves 87.1 mL MAE, the top result, confirming that 3D imaging features significantly enhance the model’s predictive capability.
Architecture & Deployment
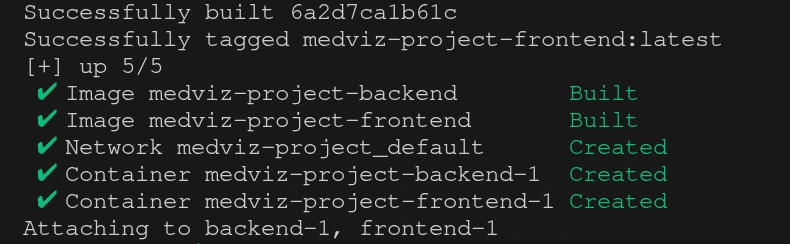
MedViz adopts a decoupled microservices architecture in 2 independent Docker containers:
- FastAPI Backend: Documented REST routes (Swagger OpenAPI), background DICOM processing (
BackgroundTasks), thread-safe SQLite database for ML results and 3D meshes. - Next.js / PulmoSight Frontend: Real-time 3D rendering of
.glblung meshes via@react-three/fiber, interactive FVC charts, severity score gauge, and DICOM upload interface.
Code Quality & Continuous Integration (CI/CD)
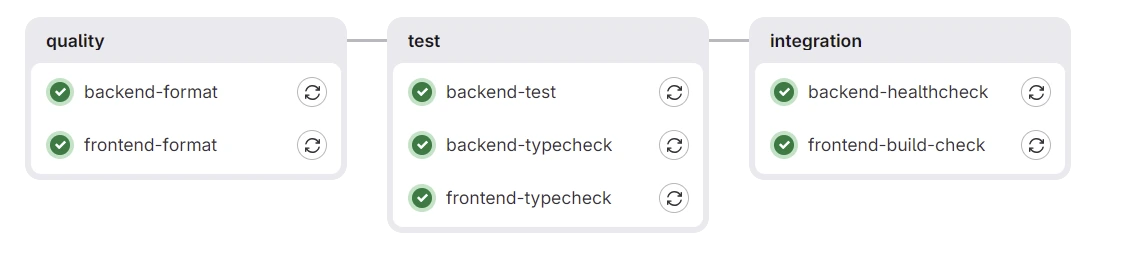
The project achieves a 91% test coverage rate on the Python backend, with a complete CI/CD pipeline (GitLab CI) structured across 3 automated phases: style checking (ruff, prettier), unit testing (pytest), and static type analysis (ty check, tsc).
| Backend Module | Pytest Coverage |
|---|---|
database.py |
100% |
schemas.py |
100% |
logger.py |
94% |
services.py |
94% |
routes.py |
89% |
processing/pipeline.py |
80% |
| TOTAL | 91% |
User Interface & Complex Web Application