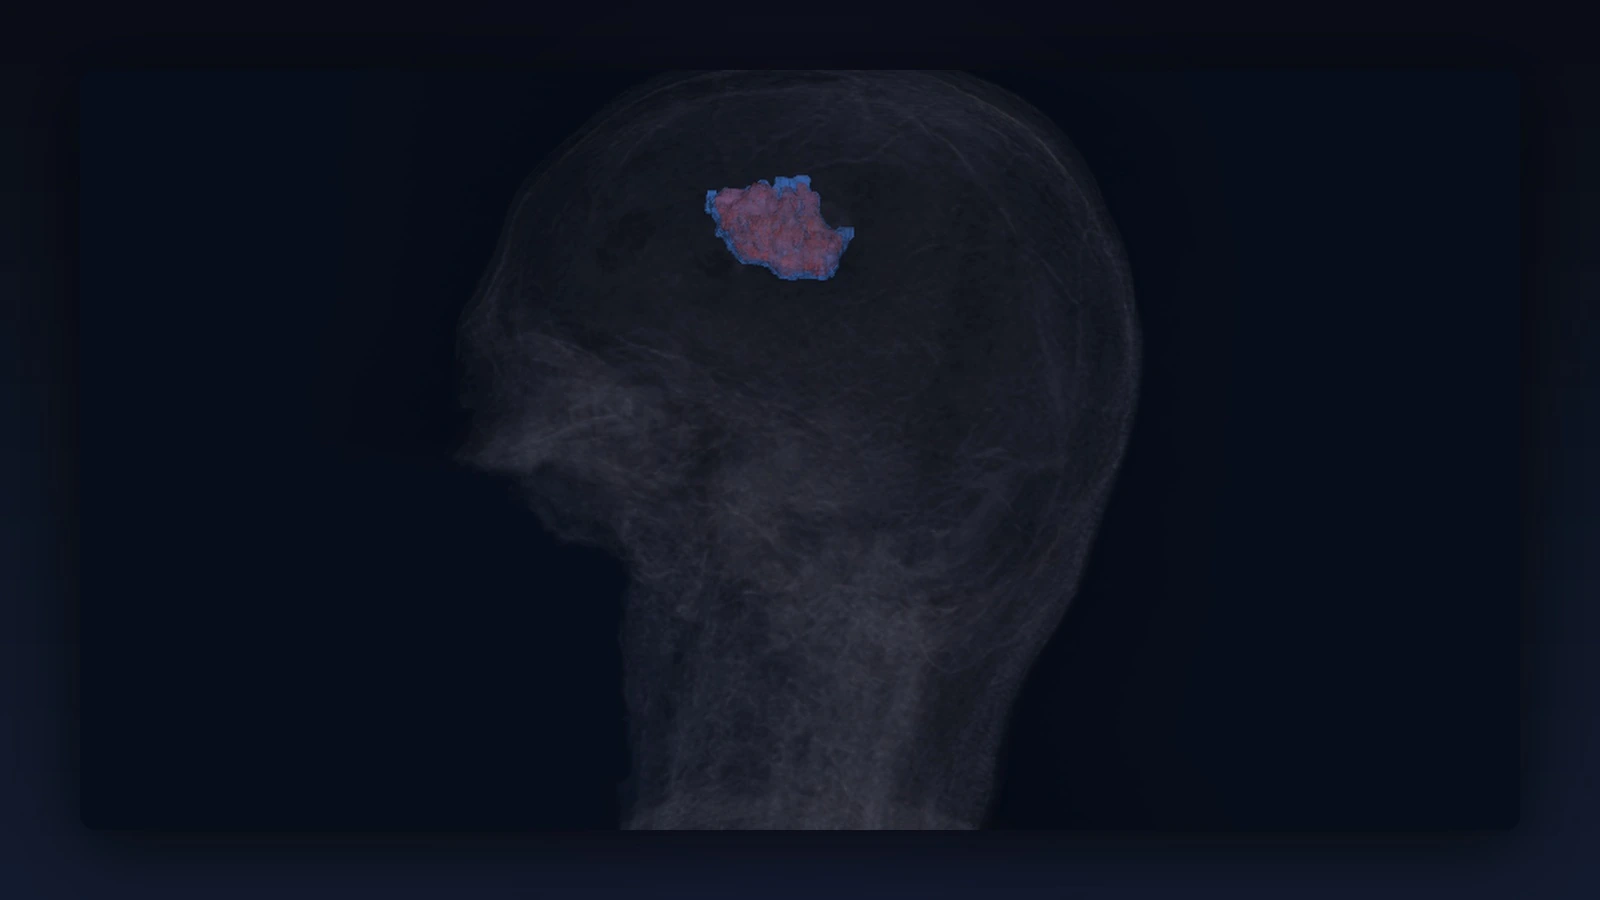
Context & Objectives
Longitudinal monitoring of brain gliomas and glioblastomas relies on temporal comparison of MRI scans performed several months apart. This project provides a full 3D medical image processing and visualization pipeline to:
- Geometrically align (3D Registration) two MRI volumes of the same patient to compensate for head orientation variations between scanning sessions.
- Isolate and segment the tumor mass before and after registration across both acquisitions.
- Compute precise volumetric evolution of the tumor (in $\text{mm}^3$ and $ ext{cm}^3$) to quantify growth or regression.
- Visualize in 2D and 3D exact alignment of anatomical structures and tumor boundaries.
The project processes two 3D MRI acquisitions in NRRD format:
case6_gre1.nrrd (baseline initial scan — fixed image) and case6_gre2.nrrd (follow-up scan — moving image).
Graphical User Interface (PyQt6 + VTK)
The application is built with PyQt6 using a medical Deep Slate dark theme, structured around two main views.
Results Dashboard
Once algorithms complete in background QThread workers, the main dashboard is presented:
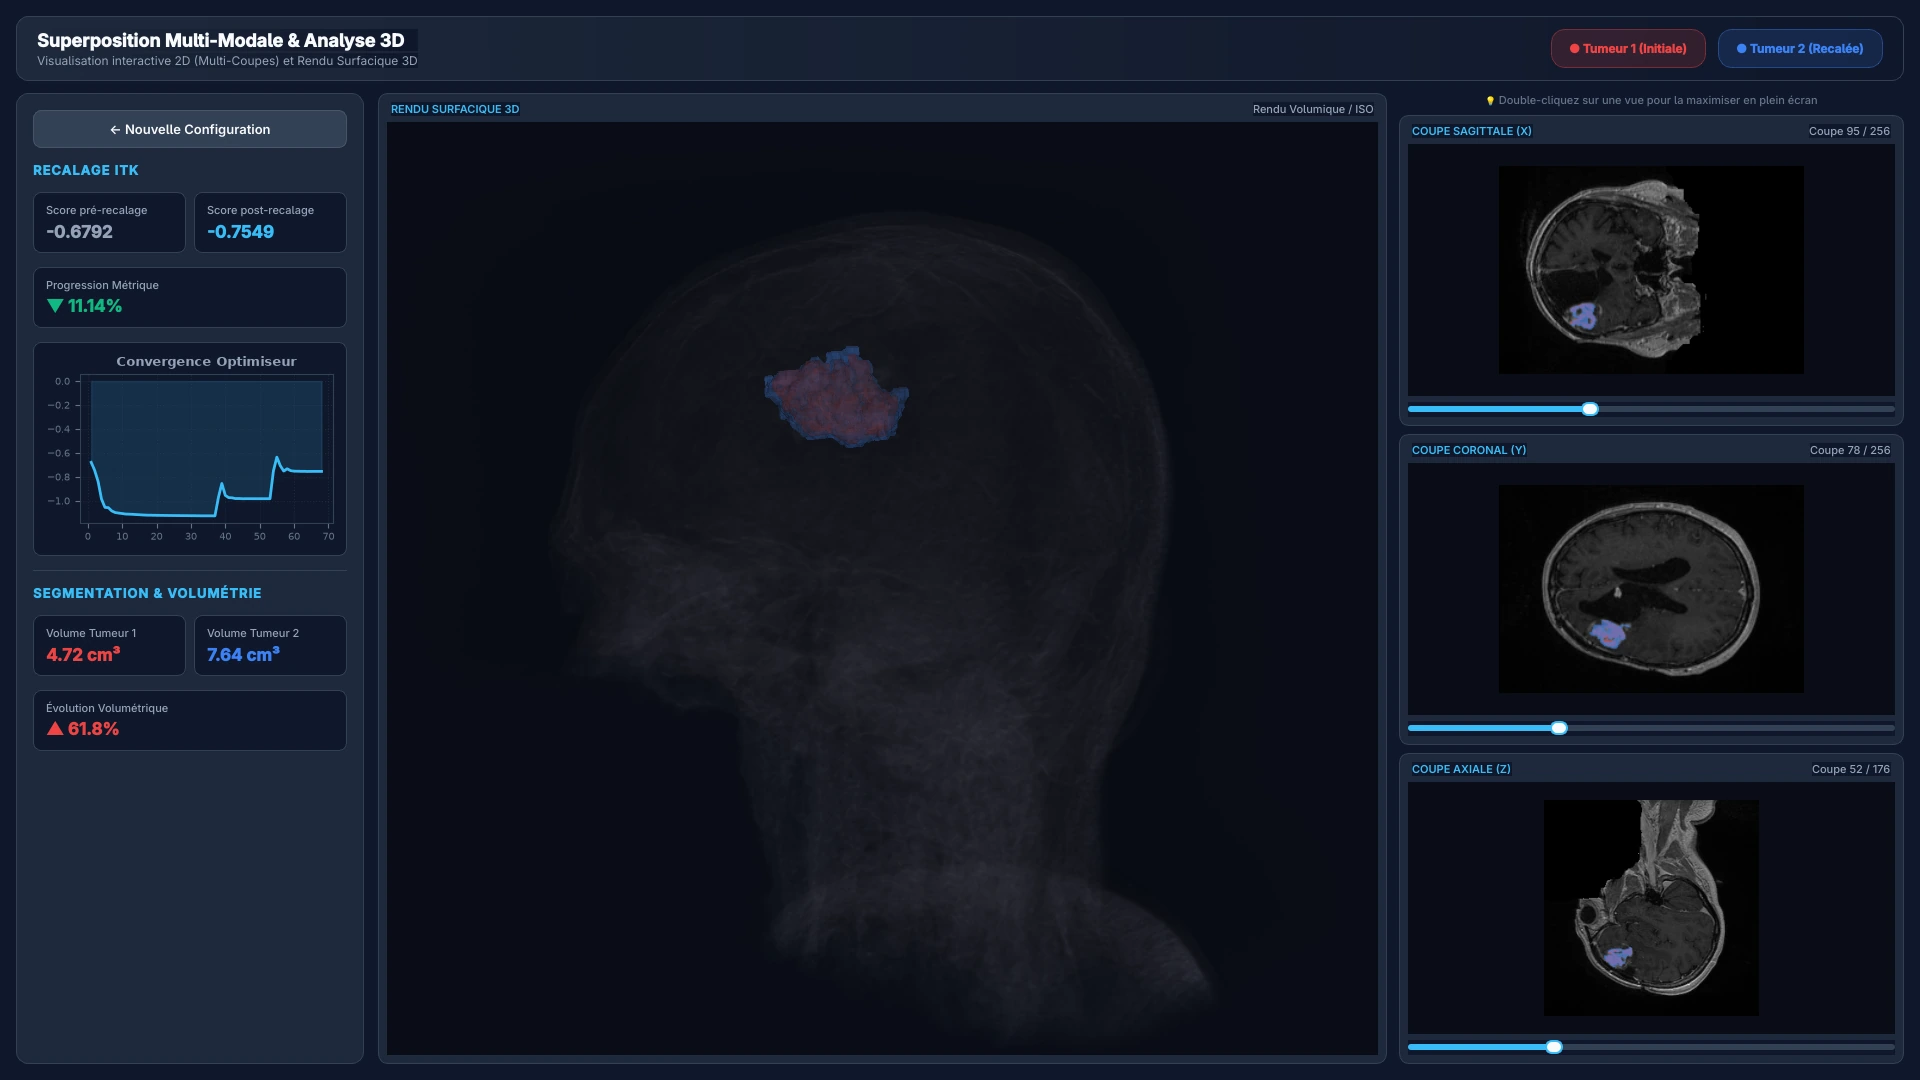
This dashboard combines:
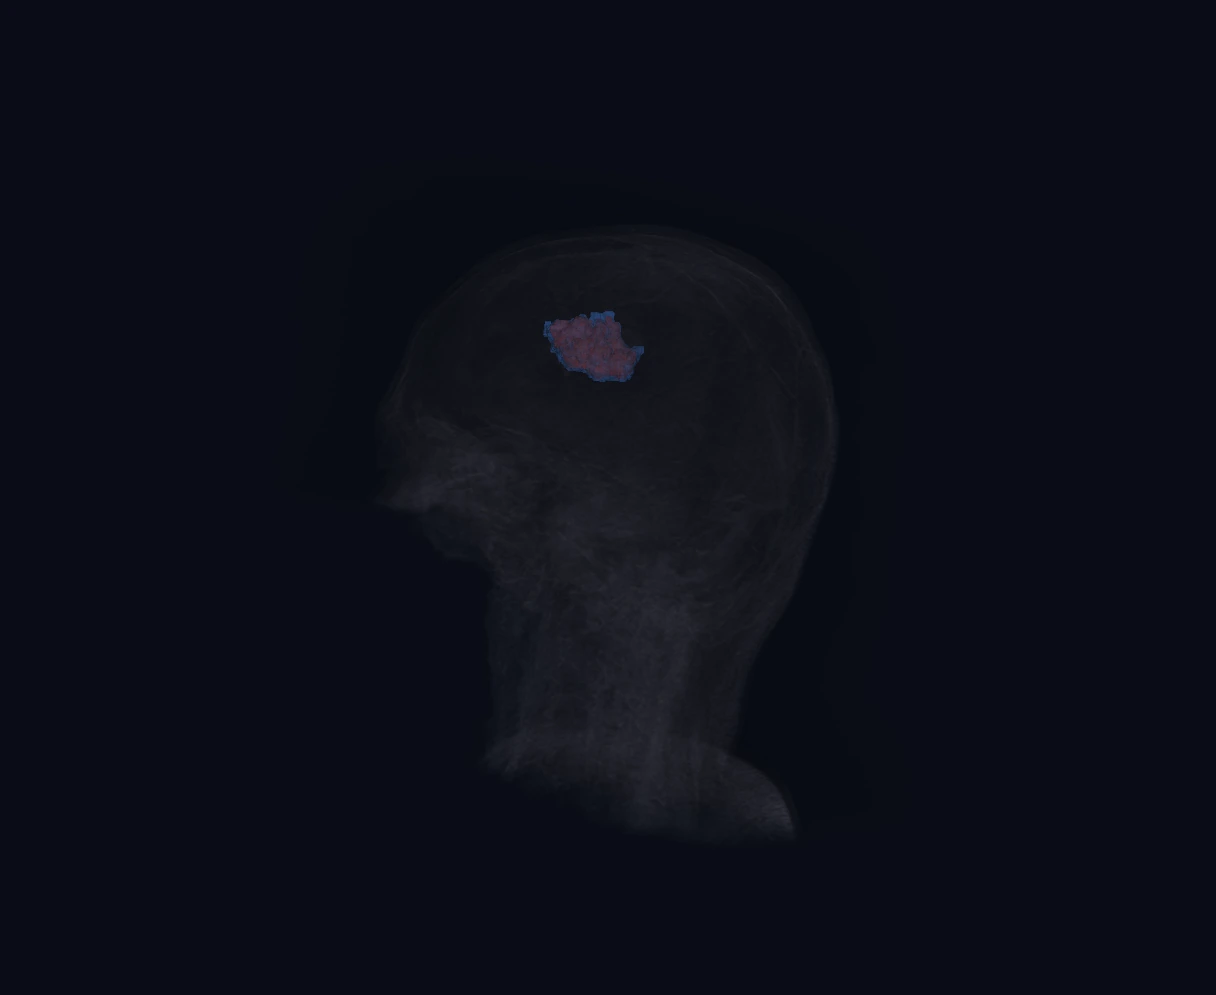
- A 3D VTK Viewport (left): Surface rendering of superimposed baseline and follow-up tumors with a semi-transparent volumetric skull.
- Three 2D Orthogonal Viewports (right): Sagittal (X), Coronal (Y), and Axial (Z) views with synchronized interactive sliders to navigate MRI slices.
- An Analytics Sidebar: Metric convergence scores pre/post registration, Matplotlib optimization plot, and calculated tumor volumetrics.
| Metric | Value |
|---|---|
| Tumor 1 Volume (Baseline) | 4.72 cm³ |
| Tumor 2 Volume (Follow-up) | 7.64 cm³ |
| Volumetric Evolution | +61.8% |
3D Medical Image Registration (ITK)
Image registration searches for a spatial transformation $\mathcal{T}: \mathbf{x} \mapsto \mathbf{x}'$ aligning moving image $M(\mathbf{x})$ onto fixed image $F(\mathbf{x})$.
Implemented Transformations
Three transformation types were developed:
| Transformation | Degrees of Freedom | Use Case |
|---|---|---|
Rigid (VersorRigid3DTransform) |
6 DOF | Head pose displacements between sessions |
Affine (AffineTransform) |
12 DOF | Global acquisition scaling & shear |
| B-Spline (Control Grid) | N DOF | Local tissue deformations |
Advanced Optimization Strategies
The ITK pipeline incorporates several mechanisms to guarantee registration robustness:
- Geometric Moments Initialization (
CenteredTransformInitializer): Aligns centers of mass prior to optimization. - Mattes Mutual Information Metric (
MattesMutualInformationImageToImageMetricv4) with 50 bins: $$\text{MI}(F, M) = \sum_{f} \sum_{m} p(f,m) \log \left( \frac{p(f,m)}{p(f)\,p(m)} \right)$$ - 3-Level Multi-Resolution Pyramid (
[4, 2, 1]shrink factors,[2, 1, 0]Gaussian sigmas) to prevent local minima traps. - 10% Random Sampling of voxels per iteration — yielding a 5× speedup without precision loss.
- Automatic Parameter Scale Estimation (
RegistrationParameterScalesFromPhysicalShift) balancing rotations (radians) and translations (millimeters).
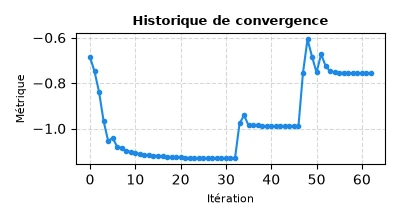
Optimizer Convergence Chart
Metric values across iterations illustrate progressive error minimization during registration:
Tumor Segmentation & 3D Volumetrics
Automatic Segmentation (Multi-Otsu + Morphological Solidity)
The automatic pipeline operates in three stages:
- Multi-Otsu Thresholding (
OtsuMultipleThresholdsImageFilter) — Splits grayscale histogram into 4 classes to isolate hyper-intense tumor cores. - Morphological Opening (
BinaryMorphologicalOpeningImageFilter) — Eliminates background noise and detaches small vascular structures using a 2D rectangular structuring element. - Connected Components & Solidity Criterion — Labels regions (
ConnectedComponentImageFilter). For each component exceeding 500 voxels, its solidity is evaluated:
The region with maximum geometric solidity is selected as the tumor.
Semi-Automatic Segmentation (Region Growing)
The ConfidenceConnectedImageFilter grows from a seed point inside the tumor into neighboring voxels whose intensity falls within:
where $\mu$ and $\sigma$ are mean and standard deviation of the current region ($c = 2.3$).
Physical-Medical Volume Calculation
Physical volume is computed from ITK voxel spacing $(s_x, s_y, s_z)$:
$$V_{\text{tumor}} \; (\text{mm}^3) = N_{\text{voxels}} \times (s_x \times s_y \times s_z)$$ $$V_{\text{tumor}} \; (\text{cm}^3) = \frac{V_{\text{tumor}} \; (\text{mm}^3)}{1000}$$Interactive 3D Visualization (VTK)
The rendering layer relies on Python VTK bindings and QVTKRenderWindowInteractor:
- 3D Surface Rendering (
vtkDiscreteMarchingCubes) — Extracts 3D isosurfaces of binary masks. Tumor 1 in red#EF4444, Tumor 2 in blue#3B82F6, with 0.95 opacity. - Anatomical Background Volume Rendering (
vtkSmartVolumeMapper) — Skull and brain tissue rendered in semi-transparent background (max opacity 0.08) viavtkColorTransferFunction. - 2D Multi-Layer Fusion (
vtkImageBlend) — Real-time blending of grayscale MRI with semi-transparent color masks viavtkImageMapToColors.
Discussion & Perspectives
Visual analysis reveals key clinical insights on this case:
- Surgical Resection Traces: A visible cavity and surgical scar indicate prior intervention.
- Peripheral Tumor Recurrence: The tumor recurs at the margin of the resected cavity, rather than growing as an isolated sphere.
- NRRD vs. HU Limitation: Unlike CT scans calibrated in Hounsfield Units, NRRD MRI values represent uncalibrated relative intensities, preventing direct intensity-based pre-filtering.
Perspectives: Integration of 3D deep learning models (nnU-Net) to overcome MRI contrast variations, and extending support to multifocal tumors.